Overview
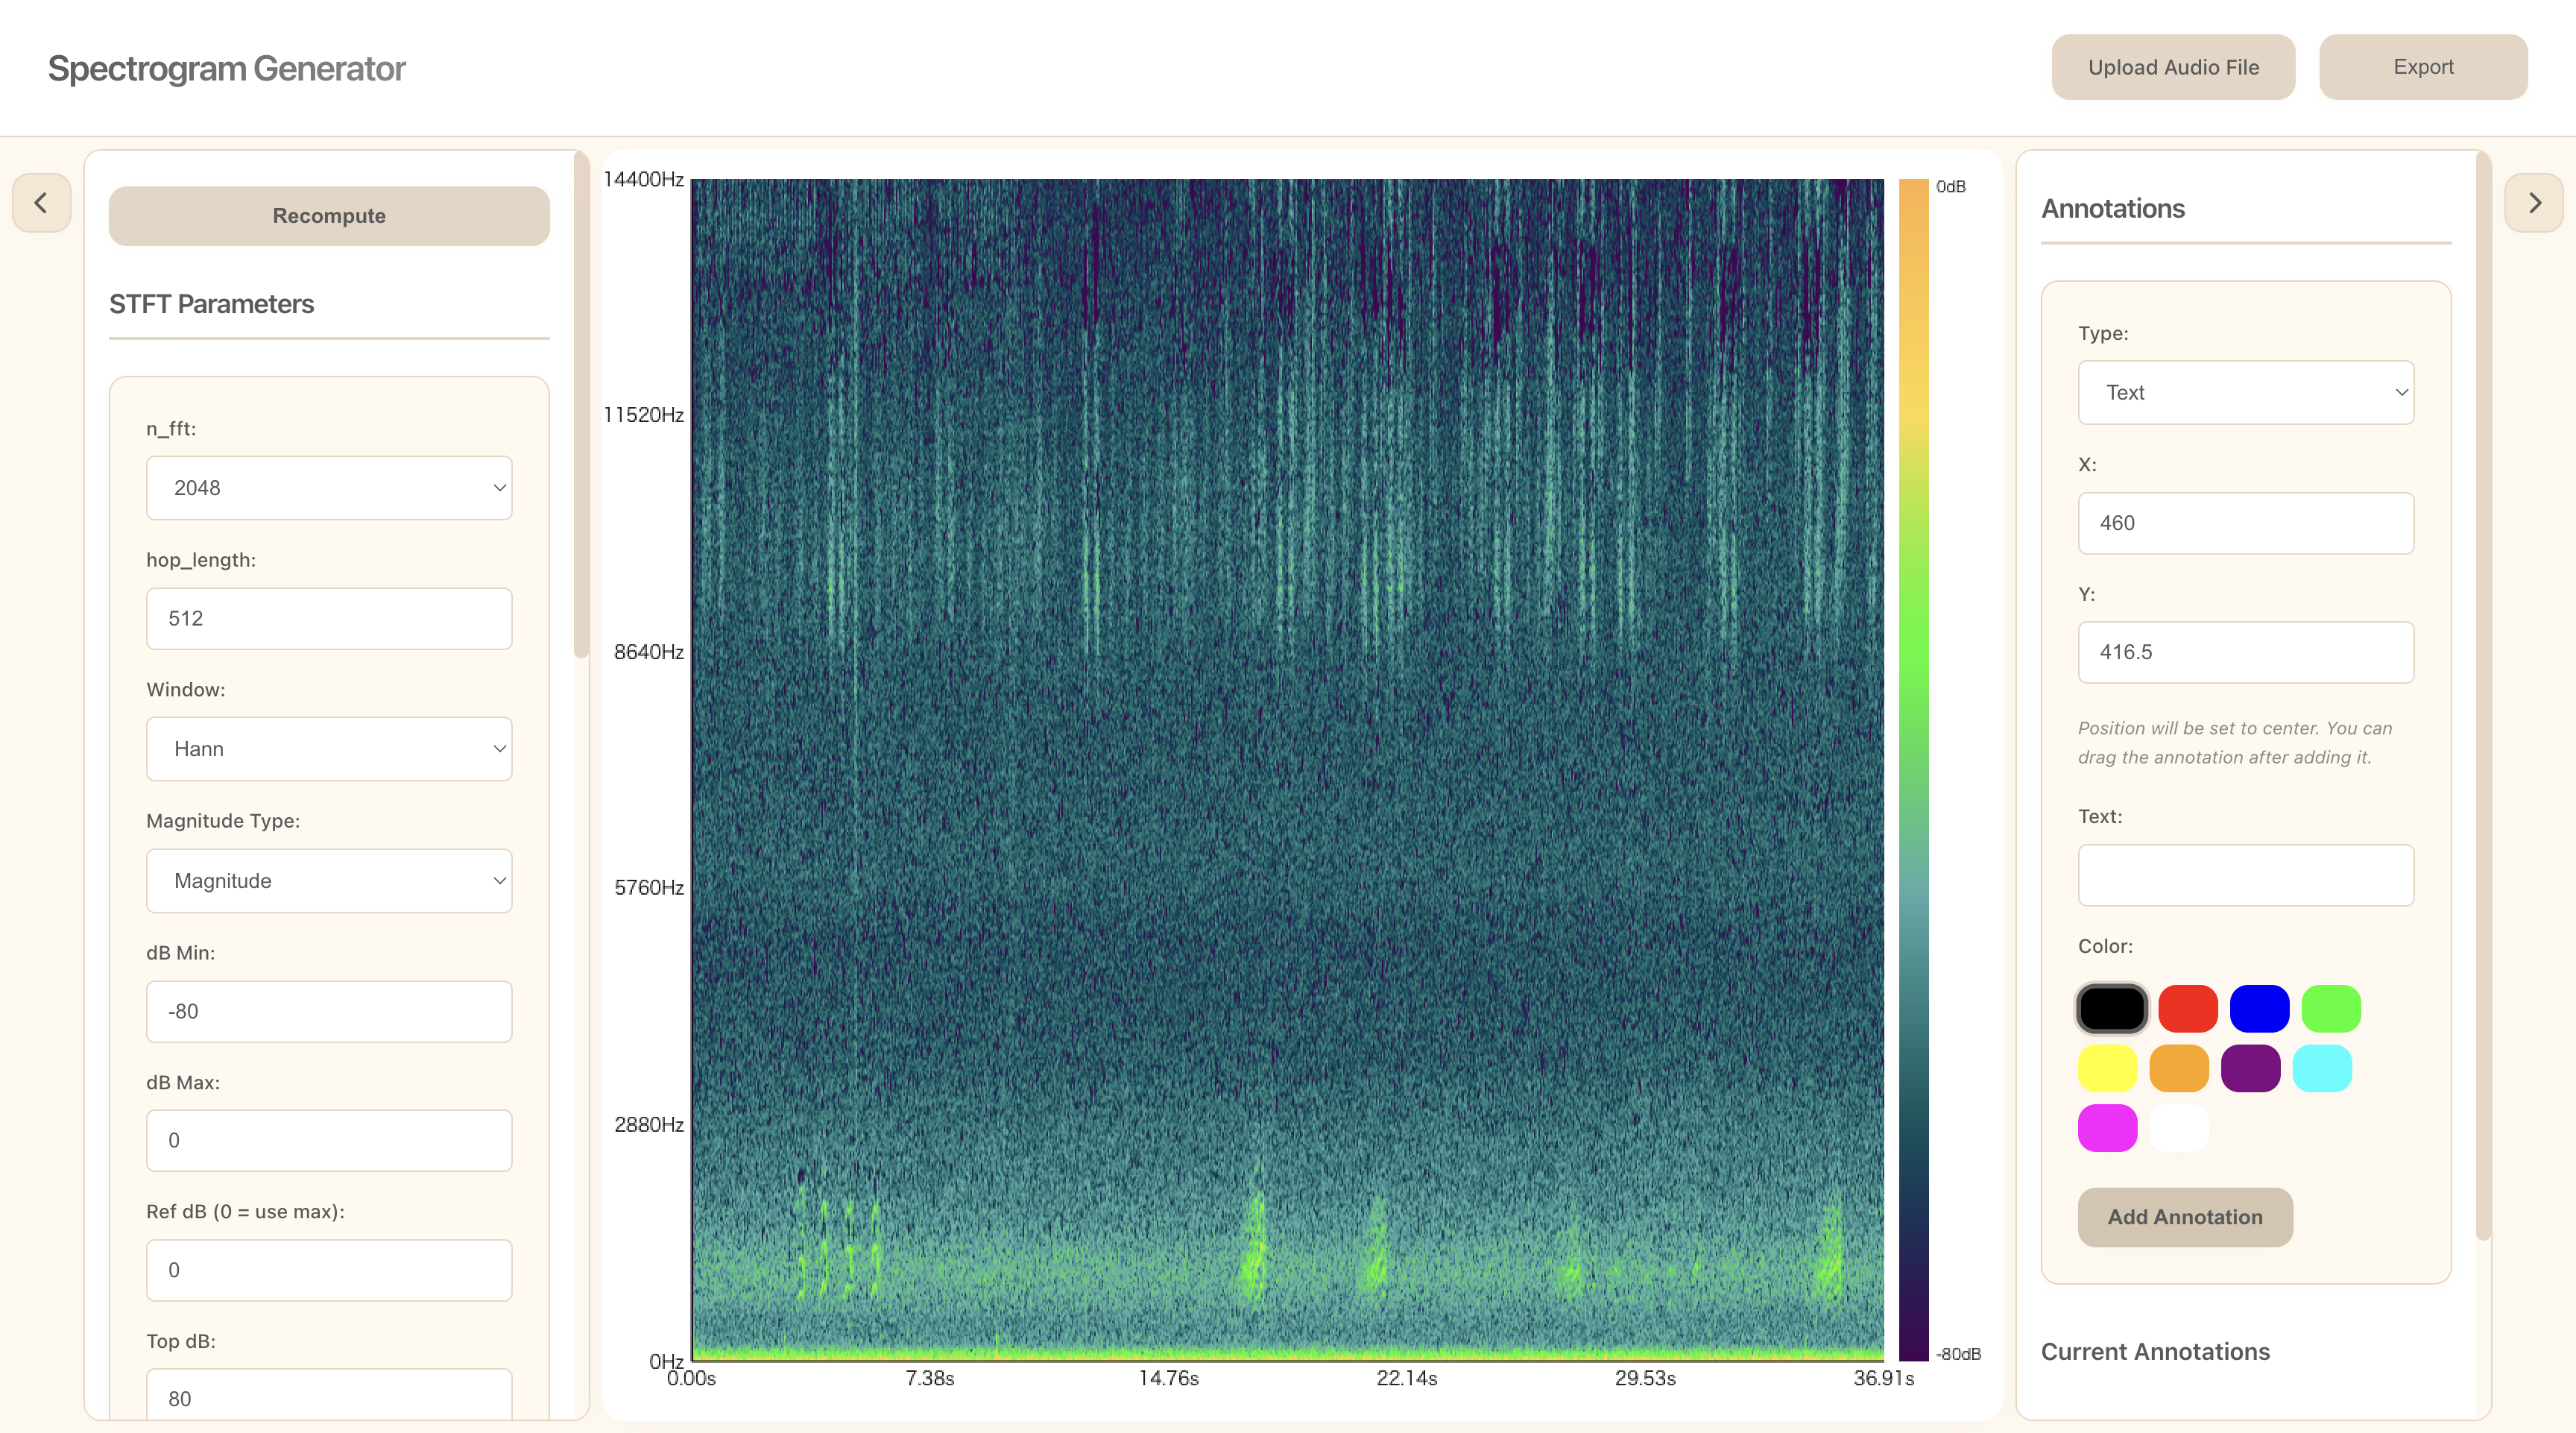
Printable Spectrogram is a fully client-side web application that generates high-resolution spectrograms comparable in configurability to librosa. It supports real-time audio input and allows publication-quality annotated exports suitable for academic papers and presentations.
No server, no backend—everything runs in the browser.
The Problem
Creating publication-quality spectrograms typically requires:
- Installing Python with librosa/matplotlib
- Writing scripts to configure STFT parameters
- Manual annotation in separate tools
- Multiple steps to get a figure ready for a paper
I wanted a tool that does all of this in the browser, with real-time preview and direct SVG/PNG export.
Features
Audio Processing (Client-side only)
- Input Sources: WAV file upload or real-time microphone input
- STFT Configuration:
n_fft(1024 / 2048 / 4096)hop_length- Window functions (Hann, Hamming, Blackman)
- Magnitude or power spectrum
- dB scaling with adjustable range
- Optional mel-scale frequency axis
- Noise reduction via spectral subtraction
Visualization
- High-quality spectrogram rendering (Canvas/WebGL)
- Multiple colormaps (viridis, magma, grayscale)
- Adjustable brightness, contrast, gamma
- Axes with proper time (seconds) and frequency (Hz/mel) labels
- Colorbar with dB scale
Annotation Layer
- SVG-based annotation layer over the spectrogram
- Text labels, arrows, rectangles, highlights
- Annotations remain vector-based (not rasterized)
Publication-Quality Export
- SVG: Spectrogram + annotations as scalable vector graphics
- PNG: User-defined resolution (300–600 dpi for print)
- Exported figures ready for direct use in academic papers
Tech Stack
- DSP Core: Rust compiled to WebAssembly (rustfft)
- Frontend: React + TypeScript + Vite
- Visualization: Canvas API
- Annotations: SVG
- Testing: Vitest (TypeScript), Cargo (Rust)
Architecture
This project follows Clean Architecture principles with a Test-Driven Development approach:
┌─────────────────────────────────────────┐
│     Presentation Layer (React UI)       │
├─────────────────────────────────────────┤
│     Use Case Layer (Application)        │
├─────────────────────────────────────────┤
│     Domain Layer (Business Logic)       │
├─────────────────────────────────────────┤
│  Infrastructure Layer (WASM, Audio I/O) │
└─────────────────────────────────────────┘
Project Structure
.
├── src/
│   ├── domain/              # Pure business logic, entities, interfaces
│   ├── usecases/            # Application orchestration
│   ├── infrastructure/      # External interfaces (WASM, audio, canvas)
│   └── presentation/        # React components
├── rust-dsp/               # Rust WASM DSP core
└── tests/                  # Integration tests
Why Rust/WASM?
Heavy DSP operations like STFT require significant computation. By implementing the DSP core in Rust and compiling to WebAssembly:
- Near-native performance in the browser
- Runs in a Web Worker to keep UI responsive
- Type-safe, memory-safe audio processing
Development Status
Currently in active development. Core infrastructure is complete, with ongoing work on:
- Full UI implementation
- Web Worker integration
- Advanced annotation features
- Performance optimization